需求: 获取geojson数据以展示到echart图表中
数据精确到乡镇的情况
如果生成数据,如果精确到县级别,可以用在线的工具直接生成: http://datav.aliyun.com/portal/school/atlas/area_selector
数据精确到乡镇的情况
直接购买
目前市面上大概没有免费精确到乡镇级别的geojson数据,可以购买获得。
自己制作
通过bigemap制作
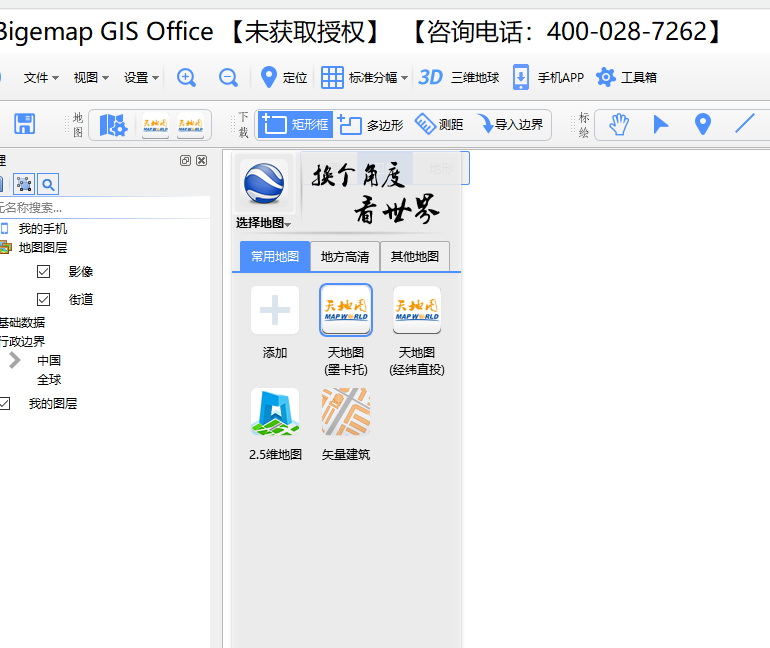
1). 下载BIGEMAP 并安装
2). 打开软件,选择地图
3). 选择完地图后,选择右上角的 “选择行政区域” → 选择后点击右下角的图片“导出边界“ → 导出kml格式文件
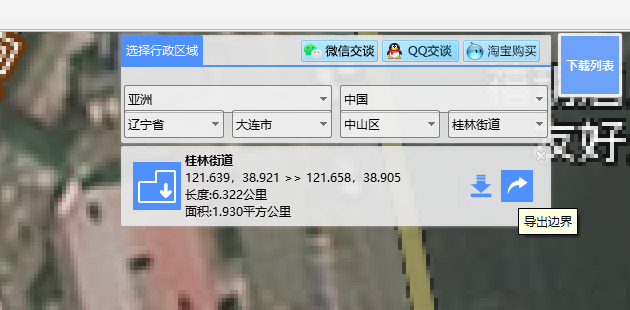
4). 比如导出 A县和A县下的所有的乡镇: 先导出A县的kml,再分别导出A县下所有乡镇的kml文件
5). kml数据重新组装
- 打开网站 http://geojson.io/ 点击做上角的 ”open” → “file” 选择文件进行导入
- 先导入A县的kml,再依次导入所有乡镇的kml数据
- 右侧json框中会自动生成对应geojson数据就是我们需要的数据了
参考 https://blog.csdn.net/BigTony/article/details/122933109
测试代码:
js
<!DOCTYPE html>
<html lang="en">
<head>
  <meta charset="UTF-8">
  <title>map</title>

  <script src="https://cdn.bootcdn.net/ajax/libs/echarts/5.3.3/echarts.js"></script>
  <script src="https://cdn.bootcdn.net/ajax/libs/jquery/3.6.0/jquery.js"></script>
  <style>
    html, body, #main {
      padding: 0px;
      margin: 0px;
      height: 100%;
      overflow: hidden;
      /*background: black;*/
    }
  </style>
</head>
<body>
<div id="main"></div>
<script type="text/javascript">
$.get("map.geojson", function (map) {
  var myChart = echarts.init(document.getElementById('main'));
  echarts.registerMap("haibei", map);
  var option = {
    series: [{
      map: "haibei",
      type: "map",
      aspectScale: 1.0,
      selectedMode: 'single',//选择类型,
      hoverable: false,//鼠标经过高亮
      roam: true,//鼠标滚轮缩放
      itemStyle: {
        normal: {
          borderWidth: 1,
          borderColor: '#0244C5',//区域边框色
          areaColor: '#0A6FF3',//区域背景色
          label: {
            show: true,
            textStyle: {
              color: 'white',//文字颜色
              fontSize: 18      //文字大小
            }
          }
        },
        emphasis: {
          borderWidth: 2,
          areaColor: "#fff",
          label: {
            show: true,
            textStyle: {
              color: '#6495ED'
            }
          }
        }
      },
    }]
  };
  myChart.setOption(option);
});
</script>
</body>
</html><!DOCTYPE html>
<html lang="en">
<head>
<meta charset="UTF-8">
<title>map</title>
<script src="https://cdn.bootcdn.net/ajax/libs/echarts/5.3.3/echarts.js"></script>
<script src="https://cdn.bootcdn.net/ajax/libs/jquery/3.6.0/jquery.js"></script>
<style>
html, body, #main {
padding: 0px;
margin: 0px;
height: 100%;
overflow: hidden;
/*background: black;*/
}
</style>
</head>
<body>
<div id="main"></div>
<script type="text/javascript">
$.get("map.geojson", function (map) {
var myChart = echarts.init(document.getElementById('main'));
echarts.registerMap("haibei", map);
var option = {
series: [{
map: "haibei",
type: "map",
aspectScale: 1.0,
selectedMode: 'single',//选择类型,
hoverable: false,//鼠标经过高亮
roam: true,//鼠标滚轮缩放
itemStyle: {
normal: {
borderWidth: 1,
borderColor: '#0244C5',//区域边框色
areaColor: '#0A6FF3',//区域背景色
label: {
show: true,
textStyle: {
color: 'white',//文字颜色
fontSize: 18 //文字大小
}
}
},
emphasis: {
borderWidth: 2,
areaColor: "#fff",
label: {
show: true,
textStyle: {
color: '#6495ED'
}
}
}
},
}]
};
myChart.setOption(option);
});
</script>
</body>
</html>相关问题: 导出的文件可能不能用。 echarts bug修改 通过bigemap和geojson获取echarts精确到乡镇、街道的地图json数据和undefined (reading ‘length‘)报错问题_猪猪大魔王db的博客-CSDN博客_echarts乡镇地图数据